

An Introduction to X-ray Powder Diffraction Analysis
When a beam of X-rays illuminates a single crystal, many “spots” are generated. The positions of the spots are determined by the size and shape of the unit cell and the symmetry. The intensities of the spots are determined by the arrangement of the atoms within the crystal. After measuring the intensities of all of the diffraction spots (reflections), it is generally possible to determine the positions of the atoms in the unit cell (the structure) in a straightforward manner. Sometimes, however, the sample is more complex (twinning, aperiodic structure, diffuse scattering), and the structural analysis becomes a challenge for even the most skilled crystallographers.
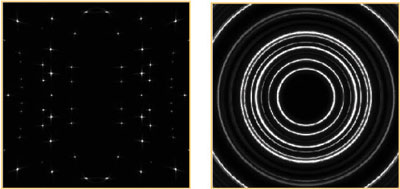
Image 1
Most real solids are not single crystals (that is why we prize gem single crystals so much!), but are composed of large numbers of tiny crystals, so are described as polycrystalline. In the diffraction pattern, the effect is that each of the spots is spread out into a ring. If the crystallites are oriented randomly, the rings are uniform, and no information is lost by measuring along a radius vector of the complete 3-dimensional diffraction pattern. The result is a plot of diffracted intensity vs. angle - a powder pattern:
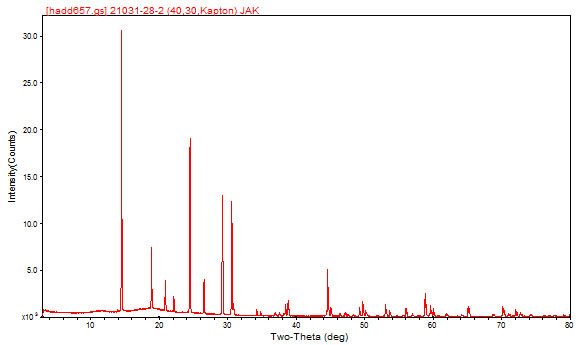
Image 2
Qualitative Phase Analysis
Because the positions of the peaks in a powder pattern are determined by the size, shape, and symmetry of the unit cell and the peak intensities are determined by the arrangement of atoms within the cell, the powder pattern is a characteristic “fingerprint” of a phase. In a mixture of phases, the diffraction patterns overlap (but do not otherwise interfere), so it is possible to identify the components of a mixture. In practice, the experimental powder pattern is searched against the Powder Diffraction File, a database containing the patterns of > 700,000 pure compounds, produced by the International Centre for Diffraction Data (www.icdd.com). Using such search/match techniques, it is easy to identify the compound giving rise to the previous powder pattern as vanadium(III) tris(dihydrogen phosphate), V(H2PO4)3.
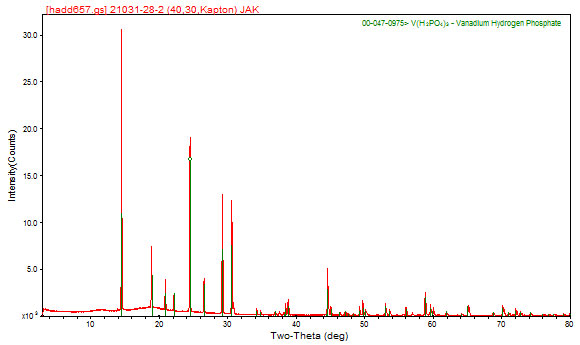
Image 3
Using contemporary algorithms and the PDF database, the major components of mixtures can generally be identified. New compounds not present in the database, are (of course) tougher to identify, but such compounds present interesting research problems! Identifying minor or trace phases can require special techniques. To learn more about how to identify trace phases, come to the workshop on Trace Phase Identification Using Chemical Information at the 2010 Denver X-ray Conference (www.dxcicdd.com), taught by Tim Fawcett and Jim Kaduk.
Quantitative Phase Analysis
As the concentration of a phase in a mixture varies, the intensities of all of the peaks from this phase vary in concert (ideally). Thus, the concentrations of phases in a mixture can be determined by measuring the intensities of peaks in the powder pattern. The traditional techniques for quantitative phase analysis are described in standard textbooks, such as:
- Ron Jenkins and Robert L. Snyder, Introduction to X-ray Powder Diffractometry. Wiley (1996).
- Vitalij K. Pecharsky and Peter Y. Zavalij, Fundamentals of Powder Diffraction and Structural Characterization of Materials, Second Edition. Springer (2009).
- Abraham Clearfield, Joseph Reibenspies, and Nattamai Bhuvanesh, Principles and Applications of Powder Diffraction. Wiley (2008).
- Robert E. Dinnebier and Simon J. L. Billinge, Powder Diffraction: Theory and Practice. RSCX Publishing (2008).
While these traditional single-peak or peak-cluster techniques can be used if necessary, Poly Crystallography generally determines quantitative phase analyses by the Rietveld method. In a Rietveld refinement, we use the crystal structures of all of the phases and diffraction physics to do a least-squares modeling of the full diffraction pattern. Among the refined parameters are scale factors for each phase, from which the quantitative analysis is derived. The Rietveld method corrects for and/or models many of the systematic errors that can plague a powder pattern, and thus can yield more accurate and more precise results than traditional methods. With normal care, accuracy and precision of about ±2 wt% can be achieved, and with additional effort, accuracy and precision as good as ±0.1 wt% can be attained. When an internal standard is added to the sample, the concentration of amorphous material can also be quantified.
More information about quantitative phase analysis, using both traditional and full-pattern techniques, is available at the ICDD Clinic Session II - Advanced Methods in X-ray Powder Diffraction, given each year in June at ICDD Headquarters.
ab initio Crystal Structure Determination
Most crystal structures are determined using single crystal methods. Many real materials are not obtainable as single crystals, however. Improvements in data quality, algorithms, and computer powder make it increasingly possible to solve crystal structures using powder diffraction data. Techniques used include Patterson and direct methods, real space geometry optimization, Monte Carlo simulated annealing, charge flipping, stealth and guile, and working by analogy. Determination of a crystal structure from scratch can be straightforward, but more often is a true research project. Poly Crystallography Principal Scientist Jim Kaduk is well-known for his success in solv ing structures using powder diffraction data.
Lattice Parameter Determination
Many materials, particularly such inorganic examples as minerals and alloys, are solid solutions - different elements may occupy the same site in the crystal structure. Because different elements have different sizes, changes in composition result in changes in the lattice parameters (unit cell dimensions). Accurate and precise determination of the lattice parameters of a solid solution can thus be used to carry out quantitative analysis at the microscopic scale. An example is the variation in the hexagonal a lattice parameter of dolomite with Mg content:
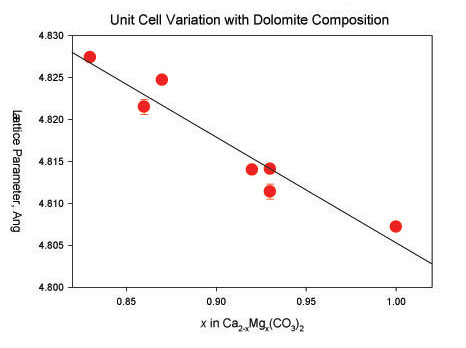
Image 4
So, from the experimental lattice parameters of dolomite from a Rietveld refinement, we can determine the composition of this phase - even in the presence of other minerals.
Microstructure Analysis - Crystallite Size and Strain
The widths and shapes of the peaks in a powder pattern are determined by many factors, including contributions both from the diffractometer and the specimen. Once the instrumental factors are understood by measuring a sample having no size or strain broadening, the crystallite size and microstrain can be determined from the experimental peak widths.
Size broadening is easier to understand. As the crystallites (coherently scattering domains, not necessarily the same size as the particles) get smaller, the diffraction peaks get wider. Using the know diffraction physics, we can work backward, and compute the average crystallite size from the observed peak widths. An “infinite” crystallite is ~2000 Å in diameter, and by the time the crystallites get as small as 30-50 Å the peaks are hard to see. So, for nanocrystalline and microcrystalline materials, accurate crystallite sizes can be obtained using X-ray diffraction. A common application is studying the sintering of metals in supported catalysts. For simple materials, even crystallite size distributions can be derived by analyzing the details of the peak shapes.
Microstrain broadening is the result of small changes in local lattice parameters resulting from defects, imperfections, and variations in the crystal structure. Solid solutions often exhibit microstrain broadening. The absolute value of mictostrain broadening may be hard to interpret, but changes in such broadening are often important practically. The dependence of mictrostrain broadening with diffraction angle is different than that of size broadening, so the two effects can be separated, if a large enough range of diffraction is observed.
Texture Analysis
Nonrandom distributions of crystallites, such as those resulting from platy or needle-like crystals or extruded and rolled specimens, can change the relative intensities of the diffraction peaks from a phase. These deviations from expected random intensities can be analyzed to derive the nature and extent of preferred orientation (texture) in a material. The physical properties of a material, such as tensile strength or barrier properties, can be a sensitive function of the texture. Texture is often visualized by a pole figure - a map (stereographic projection) of the distribution of one particular vector in a crystal structure in space.
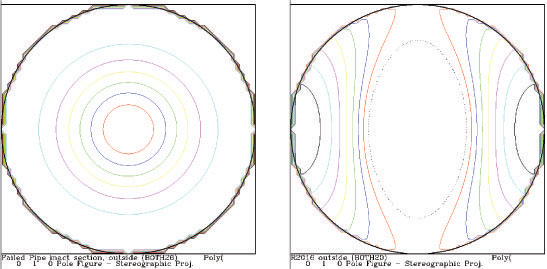
Image 5
Pair Distribution Function Analysis - Amorphous Materials
The X-ray scattering from amorphous materials leads to broad features in the powder pattern. These features can be analyzed using old mathematics (the Debye function), or more rigorously using new approaches and high-energy synchrotron or neutron diffraction. The results of either analysis is a radial distribution function (pair correlation function), which gives the electron density weighted distribution of interatomic vectors in the material. Such functions can be hard to interpret on an absolute basis, but changes in catalyst supports during use can be detected and quantified.
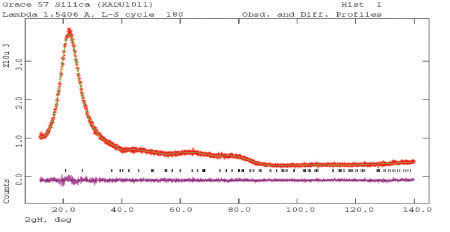
Image 6
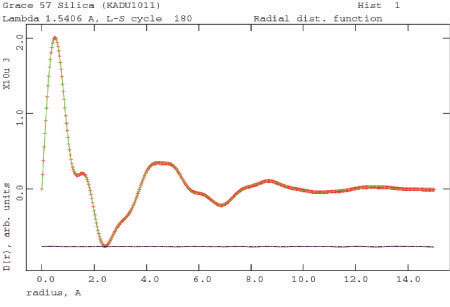
Image 7